PyAlgoは超簡単にチャートに出力できるから
以下のプログラムをsma_crossover.pyとして保存
from pyalgotrade import strategy
from pyalgotrade.technical import ma
from pyalgotrade.technical import cross


class SMACrossOver(strategy.BacktestingStrategy):
    def __init__(self, feed, instrument, smaPeriod):
        strategy.BacktestingStrategy.__init__(self, feed)
        self.__instrument = instrument
        self.__position = None
        # We'll use adjusted close values instead of regular close values.
        self.setUseAdjustedValues(True)
        self.__prices = feed[instrument].getPriceDataSeries()
        self.__sma = ma.SMA(self.__prices, smaPeriod)

    def getSMA(self):
        return self.__sma

    def onEnterCanceled(self, position):
        self.__position = None

    def onExitOk(self, position):
        self.__position = None

    def onExitCanceled(self, position):
        # If the exit was canceled, re-submit it.
        self.__position.exitMarket()

    def onBars(self, bars):
        # If a position was not opened, check if we should enter a long position.
        if self.__position is None:
            if cross.cross_above(self.__prices, self.__sma) > 0:
                shares = int(self.getBroker().getCash() * 0.9 / bars[self.__instrument].getPrice())
                # Enter a buy market order. The order is good till canceled.
                self.__position = self.enterLong(self.__instrument, shares, True)
        # Check if we have to exit the position.
        elif not self.__position.exitActive() and cross.cross_below(self.__prices, self.__sma) > 0:
            self.__position.exitMarket()
以下のプログラムを違うファイル名で保存
from pyalgotrade import plotter
from pyalgotrade.barfeed import yahoofeed
from pyalgotrade.stratanalyzer import returns
import sma_crossover

# Load the yahoo feed from the CSV file
feed = yahoofeed.Feed()
feed.addBarsFromCSV("orcl", "orcl-2000.csv")

# Evaluate the strategy with the feed's bars.
myStrategy = sma_crossover.SMACrossOver(feed, "orcl", 20)

# Attach a returns analyzers to the strategy.
returnsAnalyzer = returns.Returns()
myStrategy.attachAnalyzer(returnsAnalyzer)

# Attach the plotter to the strategy.
plt = plotter.StrategyPlotter(myStrategy)
# Include the SMA in the instrument's subplot to get it displayed along with the closing prices.
plt.getInstrumentSubplot("orcl").addDataSeries("SMA", myStrategy.getSMA())
# Plot the simple returns on each bar.
plt.getOrCreateSubplot("returns").addDataSeries("Simple returns", returnsAnalyzer.getReturns())

# Run the strategy.
myStrategy.run()
myStrategy.info("Final portfolio value: $%.2f" % myStrategy.getResult())

# Plot the strategy.
plt.plot()
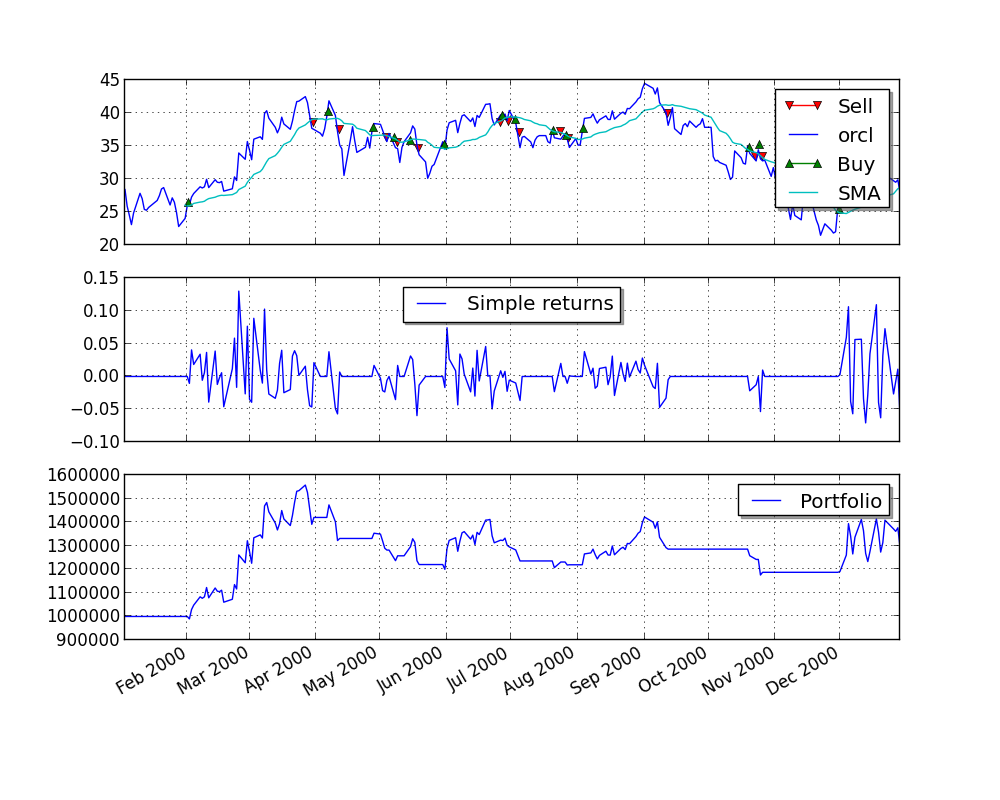
最初のサンプルで使ったorcl-2000.csv はここでも必要。ローカルディレクトリに置いておく
これを実行した結果以下のようにプロットされるはず
linuxのデスクトップ以外でこれを動かすと以下のようなエラーが出て止まる。
** (main.py:23150): WARNING **: Could not open X display
(main.py:23150): Gdk-CRITICAL **: gdk_cursor_new_for_display: assertion 'GDK_IS_DISPLAY (display)' failed
PyAlgoTradeが出力するグラフの出力先を変更したい
もちろん呼び出すほうも改造が必要、matplotlibをplotterより先にimportするのがコツ。あとはplotを呼び出すときにファイル名を指定する
import matplotlib
matplotlib.use('Agg')
from pyalgotrade import plotter
from pyalgotrade.barfeed import yahoofeed
from pyalgotrade.stratanalyzer import returns
import sma_crossover

# Load the yahoo feed from the CSV file
feed = yahoofeed.Feed()
feed.addBarsFromCSV("orcl", "orcl-2000.csv")

# Evaluate the strategy with the feed's bars.
myStrategy = sma_crossover.SMACrossOver(feed, "orcl", 20)

# Attach a returns analyzers to the strategy.
returnsAnalyzer = returns.Returns()
myStrategy.attachAnalyzer(returnsAnalyzer)

# Attach the plotter to the strategy.
plt = plotter.StrategyPlotter(myStrategy)
# Include the SMA in the instrument's subplot to get it displayed along with the closing prices.
plt.getInstrumentSubplot("orcl").addDataSeries("SMA", myStrategy.getSMA())
# Plot the simple returns on each bar.
plt.getOrCreateSubplot("returns").addDataSeries("Simple returns", returnsAnalyzer.getReturns())

# Run the strategy.
myStrategy.run()
myStrategy.info("Final portfolio value: $%.2f" % myStrategy.getResult())

# Plot the strategy.
plt.plot(None,None,"test.png")
以下3行を書き換えました
最初の2行
import matplotlib
matplotlib.use('Agg')
最後の1行
plt.plot(None,None,"test.png")
0 件のコメント:
コメントを投稿